iyeung144.github.io
My Github Pages
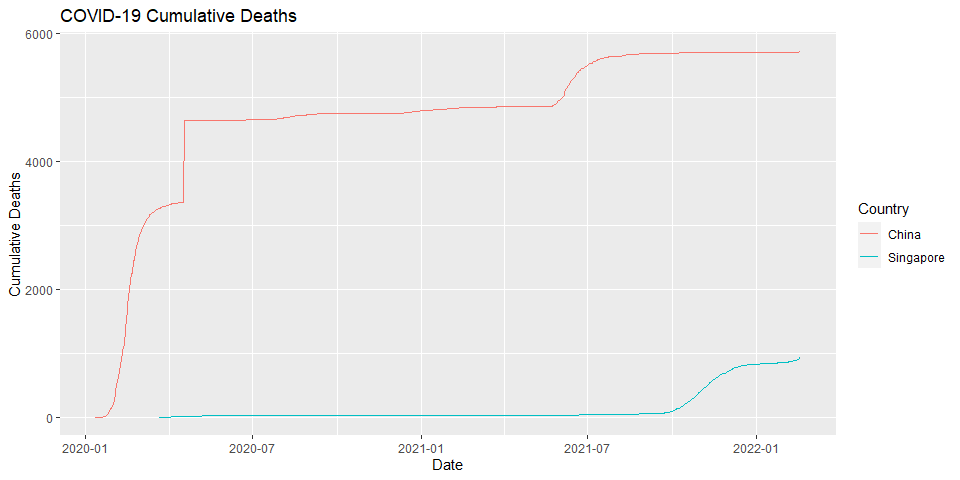
COVID-19 Cumulative Deaths
by Yeung Ka Ming, CFA
Summary
COVID-19 Cumulative Deaths for selected countries
R Libraries
library(ggplot2)
library(tidyverse)
Preparation of data
Download data from WHO website
covid.data <- read.csv("WHO-COVID-19-global-data.csv", header = TRUE, sep = ",", encoding ="UTF-8")
Tidy data
# rename date column header
colnames(covid.data)[1] <- "Date_reported"

# change data frame to tibble and specify date column as Date format
covid.data.tbl <- as_tibble(covid.data) %>%
  mutate(Date_reported = as.Date(Date_reported))
# pick Singapore and China and make tibble "long"
covid.data.tbl1 <- covid.data.tbl %>%
  filter(Country == "Singapore" | Country == "China" ) %>%
  pivot_longer("Cumulative_deaths",
               names_to = "Cumulative_deaths_key",
               values_to = "Cumulative_deaths_value") %>%
  filter(Cumulative_deaths_value > 0)
Plot graph
# plot graph
p <- ggplot(covid.data.tbl1, aes(x = Date_reported,
                                 y = Cumulative_deaths_value, color=Country))
p + geom_line() +
  ggtitle("COVID-19 Cumulative Deaths") +
  ylab("Cumulative Deaths") +
  xlab("Date")