iyeung144.github.io
My Github Pages
Equity Index Standard Deviation
by Yeung Ka Ming, CFA
Summary
Equity Index (Hang Seng Index of Hong Kong) and Standard Deviation Relationship
R Libraries
library(tidyverse)
library(quantmod)
library(ggplot2)
Preparation of data
Direct download by getSymbols
tickers <- c("^HSI","^GSPC")
getSymbols(Symbols = tickers,
           src = "yahoo",
           index.class = "POSIXct",
           from = "1997-01-01")
## [1] "^HSI" "^GSPC"
Drop the NA and add daily return column, daily standard deviation (SD) and annualised SD
GSPC.new <- na.omit(GSPC)
GSPC.new <- merge(GSPC.new, dailyReturn(GSPC.new$GSPC.Adjusted))
colnames(GSPC.new)[7] <- "GSPC.adj.ret"
GSPC.new <- merge(GSPC.new,rollapply(GSPC.new$GSPC.adj.ret, 252, sd))
colnames(GSPC.new)[8] <- "GSPC.adj.std"
GSPC.new <- merge(GSPC.new, GSPC.new$GSPC.adj.std*sqrt(252))
colnames(GSPC.new)[9] <- "GSPC.adj.std.annualised"

HSI.new <- na.omit(HSI)
HSI.new <- merge(HSI.new, dailyReturn(HSI.new$HSI.Adjusted))
colnames(HSI.new)[7] <- "HSI.adj.ret"
HSI.new <- merge(HSI.new,rollapply(HSI.new$HSI.adj.ret, 252, sd))
colnames(HSI.new)[8] <- "HSI.adj.std"
HSI.new <- merge(HSI.new, HSI.new$HSI.adj.std*sqrt(252))
colnames(HSI.new)[9] <- "HSI.adj.std.annualised"
Convert to tibble for easier plotting
HSI.new.tbl <- as_tibble(fortify(HSI.new)) #fortify to keep the datetime index
Plot
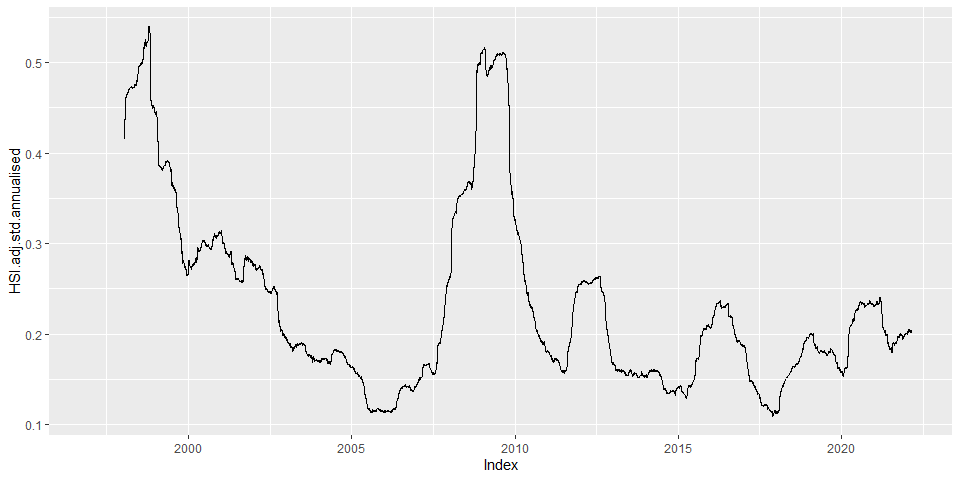
p <- ggplot(HSI.new.tbl, aes(x=Index,y=HSI.adj.std.annualised))
p+geom_line()
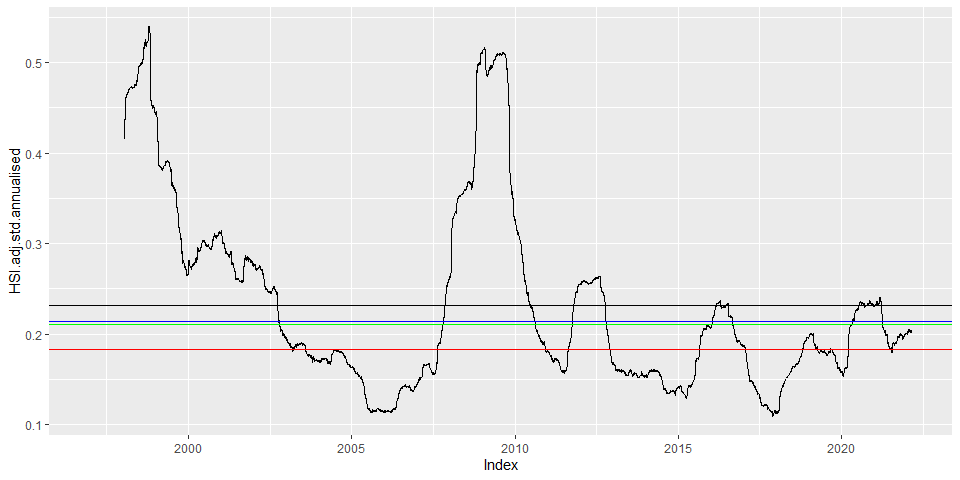
avg10yr <- mean(HSI.new$HSI.adj.std.annualised["2011/2022"])
avg15yr <- mean(HSI.new$HSI.adj.std.annualised["2006/2022"])
avg20yr <- mean(HSI.new$HSI.adj.std.annualised["2001/2022"])
avg25yr <- mean(na.omit(HSI.new$HSI.adj.std.annualised["1997/2022"]))
p+geom_line()+
  geom_hline(yintercept = avg10yr, color = "red")+
  geom_hline(yintercept = avg15yr, color = "blue")+
  geom_hline(yintercept = avg20yr, color = "green")+
  geom_hline(yintercept = avg25yr, color = "black")
HSI.new2.tbl <- HSI.new.tbl %>%
pivot_longer(cols = c("HSI.Adjusted","HSI.adj.std.annualised"),
names_to ="Series",
values_to = "Values") %>%
select(c(Index,Series,Values))
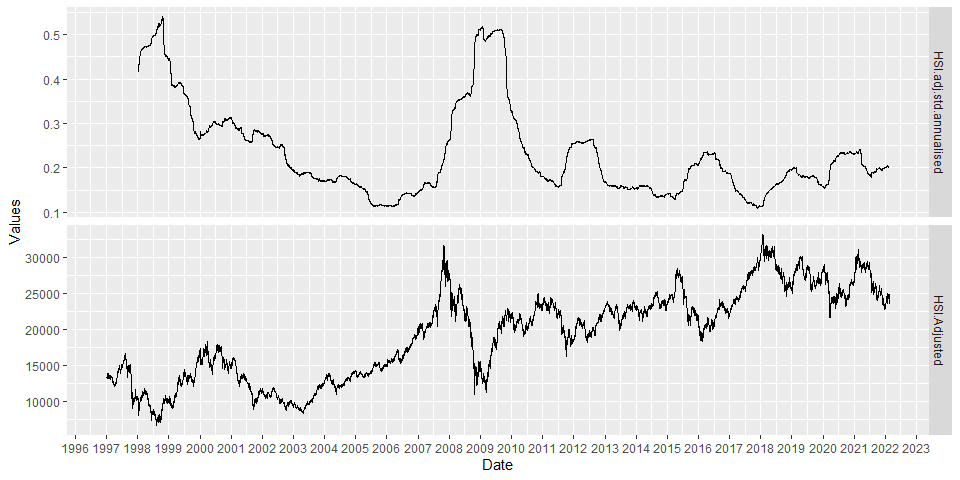
p1 <- ggplot(HSI.new2.tbl, aes(x=Index,y=Values))
p1 + geom_line() +
facet_grid(Series ~ ., scales = "free") +
scale_x_datetime(name = "Date", date_breaks = "1 year", date_labels = "%Y")