iyeung144.github.io
My Github Pages
Bollinger Bands
by Yeung Ka Ming, CFA
Summary
Bollinger Bands
R Libraries
library(quantmod)
library(TTR)
Preparation of data
tickers <- c("^HSI","^GSPC")
getSymbols(Symbols = tickers,
           src = "yahoo",
           index.class = "POSIXct",
           from = "1997-01-01")
## [1] "^HSI" "^GSPC"
Prepare technical analysis of Bollinger Bands
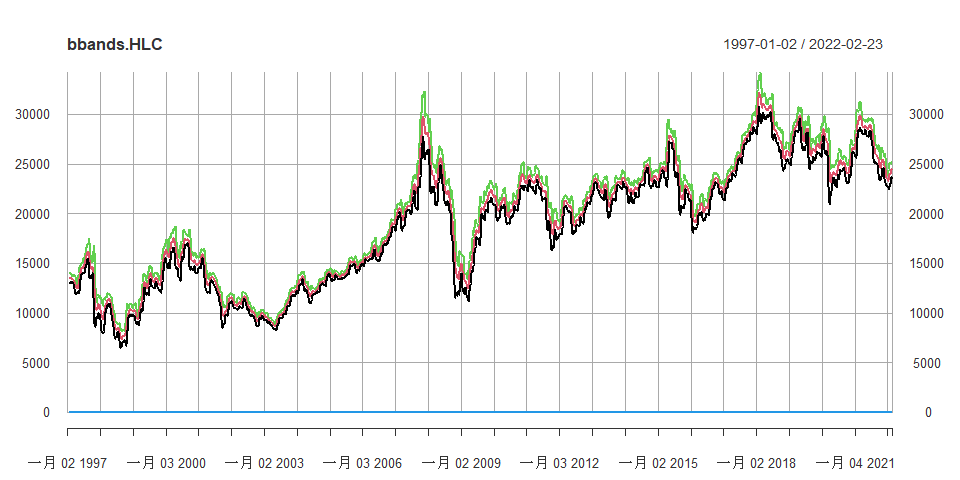
bbands.HLC <- BBands(na.omit(HSI[,c("HSI.High","HSI.Low","HSI.Close")]))
Plot
plot(bbands.HLC)
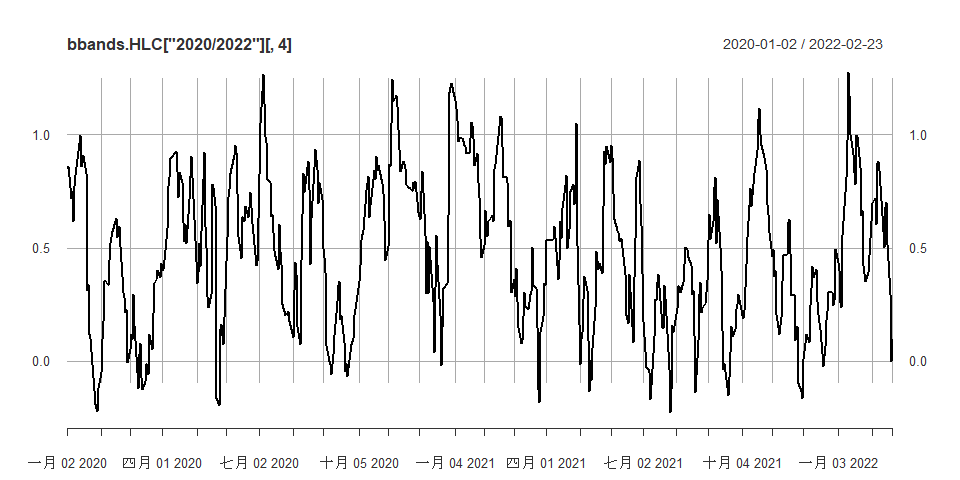
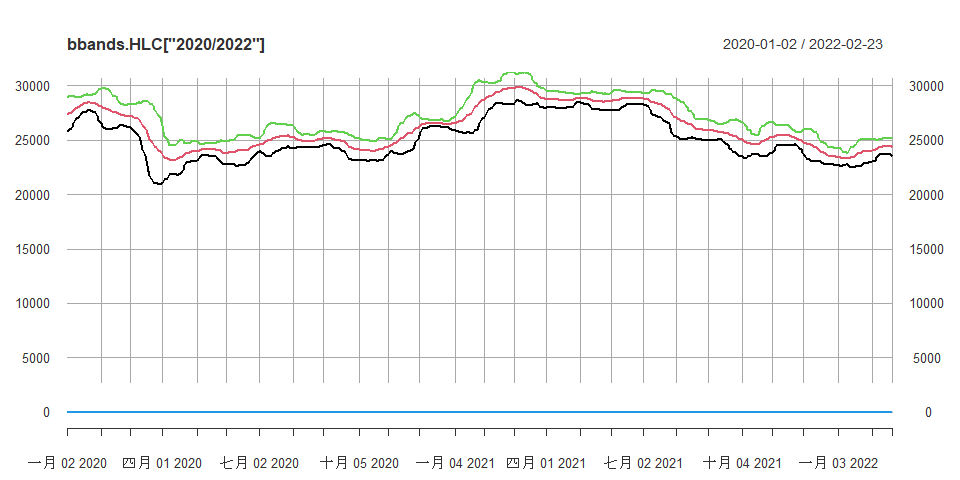
plot(bbands.HLC["2020/2022"])
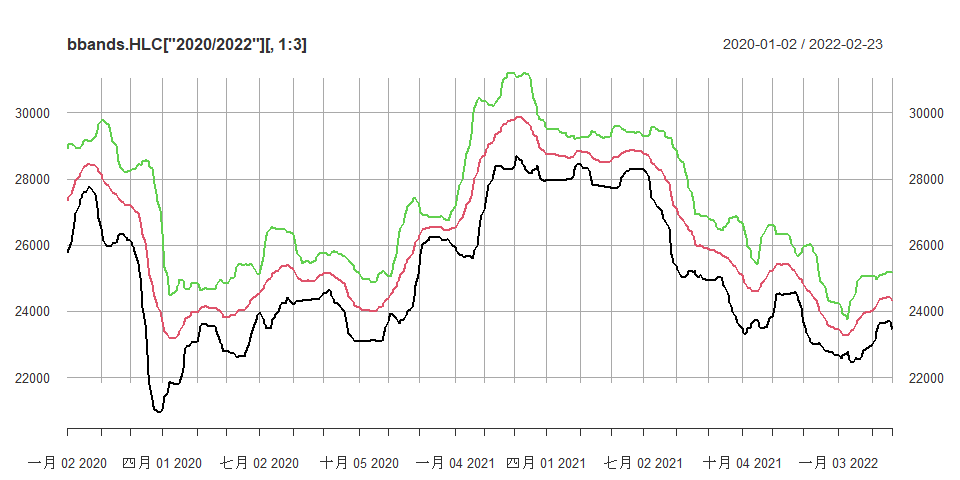
plot(bbands.HLC["2020/2022"][,1:3])
plot(bbands.HLC["2020/2022"][,4])