iyeung144.github.io
My Github Pages
Fitting Data: Hong Kong Air Pollutants
by Yeung Ka Ming, CFA
Summary
Fitting Data: Hong Kong Air Pollutants
R Libraries
library(fitdistrplus)
Preparation of data
airpollutants <- read.csv("airpollutants.csv", header = TRUE, sep = ",", encoding ="UTF-8")
head(airpollutants)
##       StationName                        DateTime  NO2   O3 SO2 CO PM10 PM2.5
## 1 Central/Western Thu, 24 Feb 2022 22:00:00 +0800 79.7 35.3 4.5  - 35.7  25.5
## 2 Central/Western Thu, 24 Feb 2022 23:00:00 +0800 98.1 19.1 4.4  - 37.2  25.9
## 3 Central/Western Fri, 25 Feb 2022 00:00:00 +0800 79.0 29.5 3.6  - 35.8  24.9
## 4 Central/Western Fri, 25 Feb 2022 01:00:00 +0800 72.6 29.1 2.7  - 32.4  22.7
## 5 Central/Western Fri, 25 Feb 2022 02:00:00 +0800 36.2 58.9 2.3  - 27.3  20.6
## 6 Central/Western Fri, 25 Feb 2022 03:00:00 +0800 32.5 50.4 2.3  - 24.4  19.2
fitdistrplus accepts vector only[1]
airdata <- as.numeric(airpollutants$NO2) # change to numeric but introduced NAs
airdata <- c(na.omit(airdata)) # omit NAs and covert data to a vector. fitdistrplus accepts numeric vector only
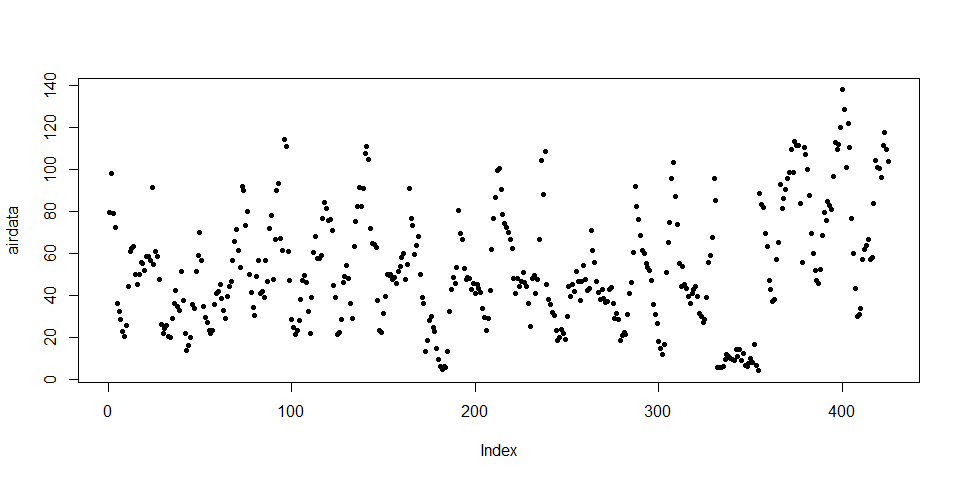
Plot data
plot(airdata,pch=20)
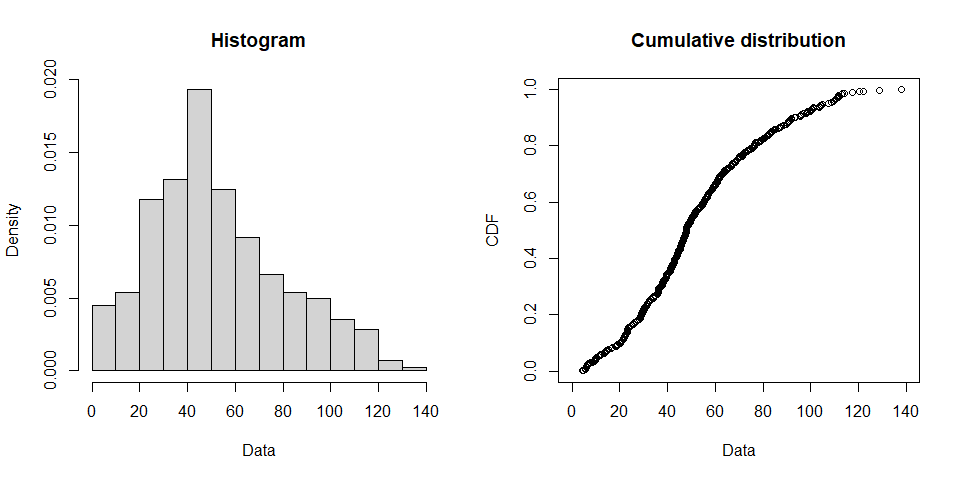
plotdist(airdata, histo = TRUE, demp = FALSE)
descdist(airdata,discrete = FALSE,boot = 500)
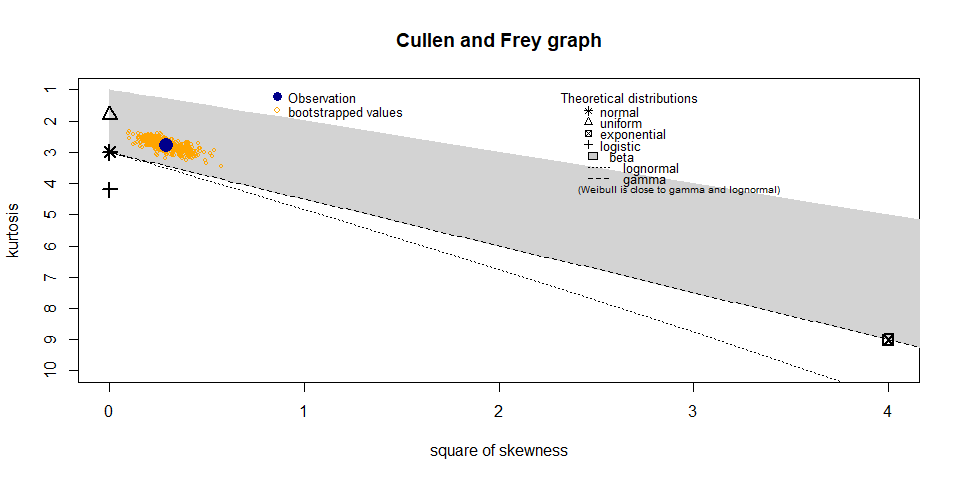
## summary statistics
## ------
## min:  4.3   max:  137.9
## median:  47.9
## mean:  52.55694
## estimated sd:  27.4781
## estimated skewness:  0.5394571
## estimated kurtosis:  2.780306
Fitting data
fit_w <- fitdist(airdata,"weibull")
fit_g <- fitdist(airdata, "gamma")
fit_ln <- fitdist(airdata, "lnorm")

summary(fit_w)
## Fitting of the distribution ' weibull ' by maximum likelihood
## Parameters :
##        estimate Std. Error
## shape  1.997389 0.07620992
## scale 59.273086 1.51460174
## Loglikelihood:  -1989.855   AIC:  3983.71   BIC:  3991.814
## Correlation matrix:
##          shape    scale
## shape 1.000000 0.311239
## scale 0.311239 1.000000
summary(fit_g)
## Fitting of the distribution ' gamma ' by maximum likelihood
## Parameters :
##         estimate  Std. Error
## shape 3.06166970 0.199430160
## rate  0.05824908 0.004121638
## Loglikelihood:  -1998.918   AIC:  4001.836   BIC:  4009.94
## Correlation matrix:
##           shape      rate
## shape 1.0000000 0.9201068
## rate  0.9201068 1.0000000
summary(fit_ln)
## Fitting of the distribution ' lnorm ' by maximum likelihood
## Parameters :
##         estimate Std. Error
## meanlog 3.789776 0.03160773
## sdlog   0.651610 0.02234980
## Loglikelihood:  -2031.672   AIC:  4067.345   BIC:  4075.449
## Correlation matrix:
##         meanlog sdlog
## meanlog       1     0
## sdlog         0     1
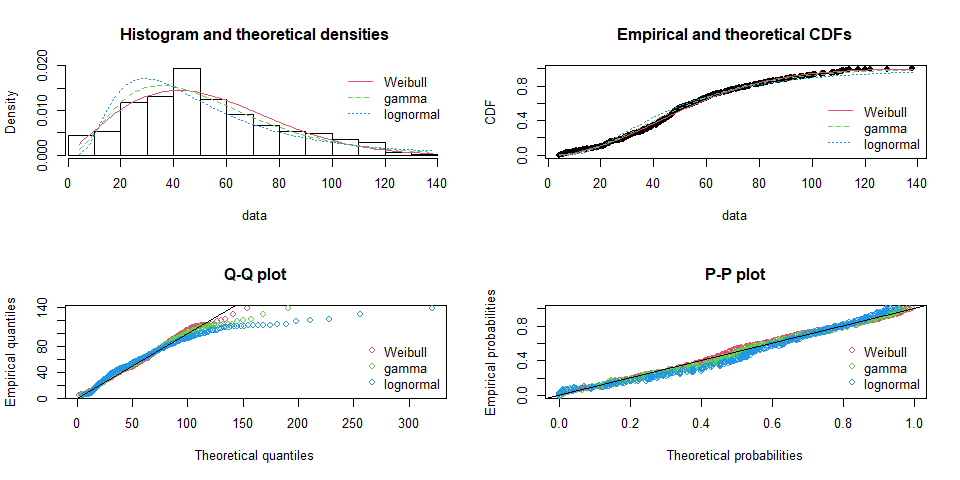
Compare different fitting results
par(mfrow=c(2,2))
plot.legend<-c("Weibull","gamma", "lognormal")
denscomp(list(fit_w,fit_g,fit_ln), legendtext=plot.legend)
cdfcomp(list(fit_w,fit_g,fit_ln), legendtext = plot.legend)
qqcomp(list(fit_w,fit_g,fit_ln), legendtext = plot.legend)
ppcomp(list(fit_w,fit_g,fit_ln), legendtext = plot.legend)
Goodness-of-fit test
gofstat(list(fit_w,fit_g,fit_ln), fitnames = c("weibull","gamma","lnorm"))
## Goodness-of-fit statistics
##                                 weibull      gamma     lnorm
## Kolmogorov-Smirnov statistic 0.03711893 0.06390271 0.1052155
## Cramer-von Mises statistic   0.12721977 0.28117347 1.0806864
## Anderson-Darling statistic   0.86932594 1.99729639 7.0892961
##
## Goodness-of-fit criteria
##                                 weibull    gamma    lnorm
## Akaike's Information Criterion 3983.710 4001.836 4067.345
## Bayesian Information Criterion 3991.814 4009.940 4075.449
Reference
[1] https://stackoverflow.com/questions/37091580/how-to-exclude-nas-fitdist-function
tags: fittingData