iyeung144.github.io
My Github Pages
Plot Hong Kong Air Pollutants Correlation
by Yeung Ka Ming, CFA
Summary
Plot Hong Kong Air Pollutants Correlation
R Libraries
library(lubridate)
library(corrplot)
library(tidyverse)
Preparation of data
airpollutants <- read.csv("airpollutants.csv", header = TRUE, sep = ",", encoding ="UTF-8")
head(airpollutants)
##       StationName                        DateTime  NO2   O3 SO2 CO PM10 PM2.5
## 1 Central/Western Thu, 24 Feb 2022 22:00:00 +0800 79.7 35.3 4.5  - 35.7  25.5
## 2 Central/Western Thu, 24 Feb 2022 23:00:00 +0800 98.1 19.1 4.4  - 37.2  25.9
## 3 Central/Western Fri, 25 Feb 2022 00:00:00 +0800 79.0 29.5 3.6  - 35.8  24.9
## 4 Central/Western Fri, 25 Feb 2022 01:00:00 +0800 72.6 29.1 2.7  - 32.4  22.7
## 5 Central/Western Fri, 25 Feb 2022 02:00:00 +0800 36.2 58.9 2.3  - 27.3  20.6
## 6 Central/Western Fri, 25 Feb 2022 03:00:00 +0800 32.5 50.4 2.3  - 24.4  19.2
airpollutants.tbl <- as_tibble(airpollutants)
airpollutants.tbl <- airpollutants.tbl %>%
  mutate(NO2 = as.double(NO2)) %>%
  mutate(O3 = as.double(O3)) %>%
  mutate(SO2 = as.double(SO2)) %>%
  mutate(CO = as.double(CO)) %>%
  mutate(PM2.5 = as.double(PM2.5))
This part is important for keeping the date and time data
prev <- Sys.getlocale("LC_TIME"); Sys.setlocale("LC_TIME", "C") # help from strptime in R Documentation
## [1] "C"
airpollutants.tbl <- airpollutants.tbl %>%
  mutate(DateTime = as_datetime(DateTime, format="%a, %d %b %Y %H:%M:%S %z")) # as_datetime from package lubridate

airpollutants.long.tbl <- airpollutants.tbl %>%
  pivot_longer(cols = c(NO2, O3, SO2, CO, PM10, PM2.5),
               names_to = "pollutants",
               values_to = "level")
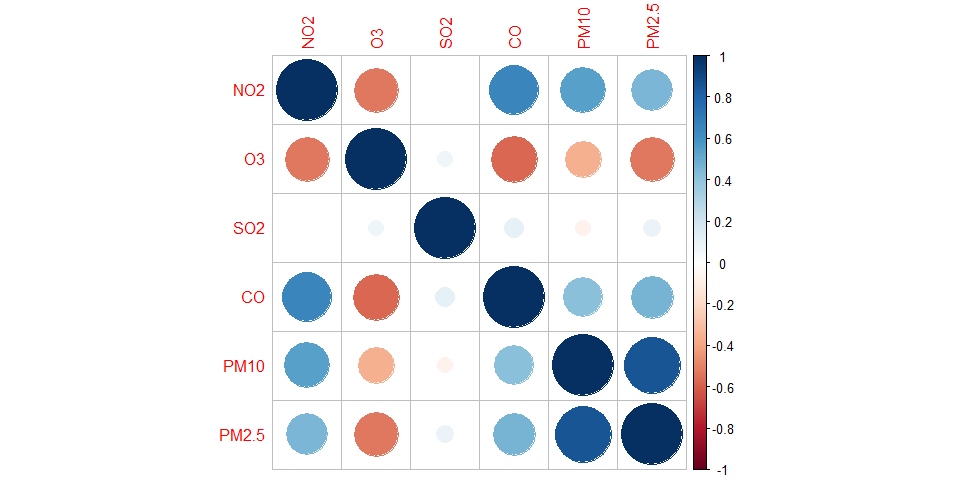
Plot correlation
cor(na.exclude(airpollutants.tbl[,3:8]))
##                 NO2          O3           SO2         CO        PM10      PM2.5
## NO2    1.0000000000 -0.52797500 -0.0008383132  0.6580114  0.54006447  0.4508194
## O3    -0.5279750023  1.00000000  0.0697662750 -0.5724707 -0.35460152 -0.5274305
## SO2   -0.0008383132  0.06976627  1.0000000000  0.1003643 -0.06847154  0.0887379
## CO     0.6580113943 -0.57247073  0.1003643199  1.0000000  0.41661612  0.4693845
## PM10   0.5400644748 -0.35460152 -0.0684715390  0.4166161  1.00000000  0.8515110
## PM2.5  0.4508194332 -0.52743051  0.0887378990  0.4693845  0.85151099  1.0000000
M <- cor(na.exclude(airpollutants.tbl[,3:8]))
corrplot(M)